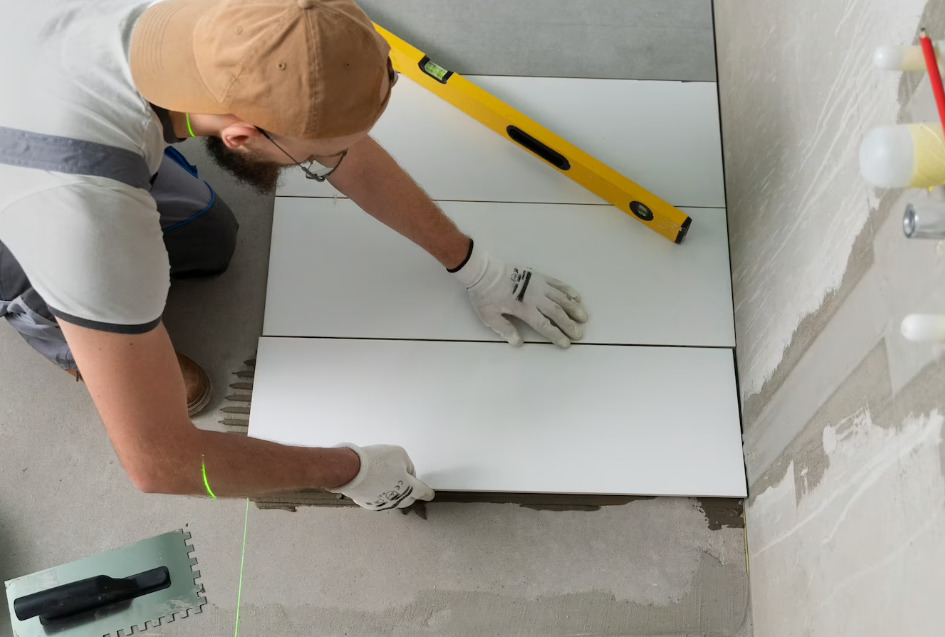
Ceramic tile installation involves meticulous planning and skilled execution to achieve visually appealing and durable surfaces. Understanding the productivity rates for different installation methods and tile sizes can facilitate effective project management and resource allocation. The table below provides an overview of estimated ceramic tile installation productivity rates for various scenarios. It’s important to note that these rates are approximate and may be influenced by project-specific variables.
Ceramic Tiles Productivity Rate
Activities |
Crew Size |
Hourly Production Rate |
Square Meters Produced by 10 Hrs |
| Ceramic tiles to walls by mortar | 1 Mason, 1 Helper | 1.2 | 8 SM |
| Ceramic tiles to walls, mortar to corridors | 1 Mason, 1 Helper | 1 | 9 SM |
| Ceramic tiles to walls, cut pieces | 1 Mason | 2 | 20 SM |
| Ceramic tiles to walls grouting | 1 Helper | 5 | 50 SM |
| Ceramic tiles to walls, by glue | 1 Mason, 1 Helper | 1,2 | 12 SM |
| Ceramic tiles to walls, corridors, by glue | 1 Mason, 1 Helper | 1,3 | 13 SM |
| Ceramic tiles to walls, by glue, cut pieces | 1 Mason | 2 | 20 SM |
| Ceramic tiles to walls, by glue, grouting | 1 Helper | 5 | 50 SM |
| Ceramic tiles to floors | 1 Mason, 1 Helper | 1 | 10 SM |
| Ceramic tiles to floors in halls | 1 Mason, 1 Helper | 1,2 | 12 SM |
| Ceramic tiles to floors, cut pieces | 1 Mason | 2 | 20 SM |
| Ceramic tiles to floors, grouting | 1 Helper | 5 | 50 SM |
| Marble flooring | 1 Mason, 1 Helper | 0.6 | 60 |
Disclaimer: This article provides general insights into ceramic tile installation productivity rates. The rates presented are estimations and may not precisely mirror the productivity rates for your specific projects. We advise gathering data from your own projects and seeking guidance from industry professionals for more accurate productivity rate calculations.
Related Articles
Productivity Rates in Construction: Full Guide
