In today’s fast-paced construction industry, timely and accurate reporting is critical for project success. Power BI is a powerful data visualization tool that can help project managers track key performance indicators (KPIs). Monitor progress, and identify potential issues before they become problems.
This blog post will explore the benefits of using Power BI for reporting in construction projects, including how it can help streamline data collection, provide real-time insights, and improve decision-making.
We will also discuss best practices for using Power BI in construction projects, including how to design effective dashboards and reports, integrate data from multiple sources, and collaborate with stakeholders.
Whether you are a project manager looking to improve your reporting capabilities or a construction professional interested in the latest data visualization trends, this blog post will provide you with valuable insights on how to leverage Power BI for better project outcomes.

Table of Contents
Introduction: the importance of reporting in construction projects
Construction projects require effective communication and collaboration to ensure timely and successful completion. Reporting is an essential component of this process, as it provides project managers and stakeholders with insights into project performance, status updates, and potential risks.
By utilizing data-driven reporting, project managers can make informed decisions, allocate resources more effectively, and identify areas for improvement.
What is Power BI?
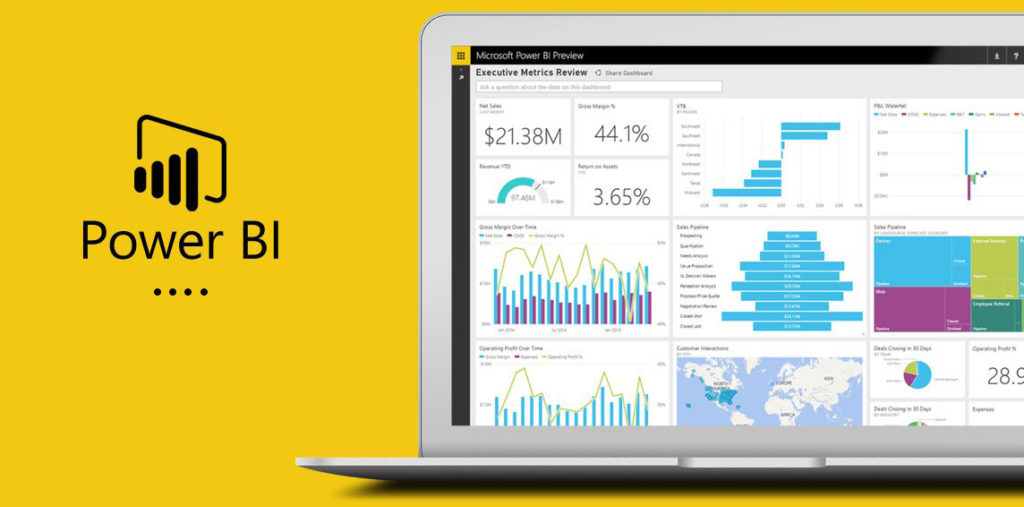
Power BI is a business analytics service by Microsoft that provides interactive visualizations and business intelligence capabilities. With an interface simple enough for end users to create their own reports and dashboards.
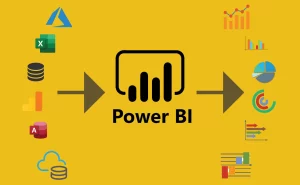
It allows users to connect to a wide variety of data sources, such as Excel spreadsheets, cloud-based and on-premises data sources, and web-based data sources.
Once the data sources are connected, Power BI’s data modeling capabilities can be used to transform and shape the data into a format that is easy to work with.
BI offers a wide range of features for reporting and data visualization, such as drag-and-drop report design, interactive filtering and highlighting, and real-time data updates.
It also offers a variety of customizable visuals and pre-built templates that can be used to create stunning reports and dashboards quickly and easily.
In addition, BI offers powerful data analysis capabilities, such as natural language queries and advanced analytics. That allows users to uncover insights and trends in their data that might otherwise go unnoticed.
This makes it an ideal tool for construction projects, where data is often complex and difficult to analyze.
Advantages of using Power BI for reporting in construction projects
Using Power BI for reporting in construction projects offers a multitude of advantages. Here are some of the key benefits:
Real-time data
Power BI provides real-time data, allowing stakeholders to monitor progress and identify issues as they arise. With the ability to track and analyze data in real-time, project managers can quickly make informed decisions that can impact the success of the project.
Data visualization
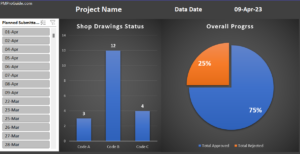
Power BI allows for the creation of interactive, visual dashboards that provide clear insights into project progress. Data can be presented in tables, charts, graphs, and other visualizations, making it easier for stakeholders to understand and act on the information.
Customization
BI is highly customizable, allowing project managers to tailor reports to meet their specific needs. They can create dashboards that highlight key performance indicators (KPIs) that matter most to their project, such as budget, schedule, quality, safety, and more.
Centralized reporting
With Power BI, all data is stored in a centralized location, making it easy for stakeholders to access and share information.
This helps to ensure that everyone is working with the most up-to-date information and that everyone is on the same page.
Enhanced collaboration
Power BI allows project teams to collaborate more effectively. Reports and dashboards can be shared with team members and stakeholders, allowing everyone to see the same information and work together to solve problems.
Improved decision-making
With real-time data, data visualization, customization, centralized reporting, and enhanced collaboration, Power BI helps project managers make better decisions.
They can quickly identify issues and opportunities, and make data-driven decisions that can impact project success.
Cost savings
By using Power BI, project managers can identify cost savings opportunities more quickly and easily. They can identify where money is being spent and find ways to reduce costs without impacting the quality of the project.
Time savings
Power BI can save time by automating the reporting process. Reports can be created automatically and distributed to stakeholders on a regular basis. Saving project managers valuable time that can be used to focus on other critical tasks.
In summary, Power BI offers a powerful tool for reporting in construction projects. With its real-time data, data visualization, customization, centralized reporting, enhanced collaboration, and cost and time savings benefits, it can help project managers make better decisions and drive project success.
How to set up Power BI for construction project reporting
- Setting up Power BI for construction project reporting can be a complex process. The first step is to identify the data sources needed for the project.
This can include data from various sources such as project management software, accounting systems, and other databases. The data must be prepared before being imported into Power BI.
This may involve cleaning, formatting, and organizing the data to ensure accuracy and consistency. Once the data is prepared, it can be imported into BI.
- Creating visuals and reports is the next step in setting up BI for construction project reporting.
This involves using various visualizations such as charts, graphs, and tables to present the data in a meaningful way.
Power BI offers a wide range of visualizations that can be customized to fit the needs of the project.
Reports can be created using drag-and-drop functionality, making it easy to create visually appealing reports. - Building a dashboard is the final step in setting up Power BI for construction project reporting.
A dashboard is a high-level view of the project’s key performance indicators (KPIs) and metrics.
This allows project managers to quickly and easily see the status of the project and identify any potential issues.
Dashboards can be customized to fit the specific needs of the project and can be accessed on any device with an internet connection.
BI offers a user-friendly interface for building and customizing dashboards, making it easy for project managers to get the information they need.
Using Business intelligence is the first step in using AI in construction projects. We have a full article related to this topic here : https://pmproguide.com/ai-generated-this-article-using-ai-in-project-management/
Examples of Power BI reports for construction projects
a. Progress tracking
BI can help construction project managers track progress by visualizing completed vs. planned tasks, identifying delays and their root causes, and predicting project timelines.
The report can include a Gantt chart, which shows the schedule of tasks in a timeline format, along with key performance indicators such as percent complete, remaining work, and task dependencies.
b. Budget monitoring
BI can help construction project managers monitor and control project costs by providing real-time visibility into project expenses, including labor, materials, and equipment.
However, the report can include a detailed breakdown of project costs, actual vs. budgeted costs, and cost variances, enabling project managers to identify and address cost overruns.
c. Resource allocation
BI can help construction project managers optimize resource allocation by providing insights into how resources are being utilized across multiple projects. The report can include a resource utilization matrix, which shows the availability and utilization of resources such as labor, equipment, and materials.
By identifying underutilized resources and optimizing their allocation, project managers can improve project efficiency and reduce costs.
Tips for Effective Reporting with Power BI in Construction Projects

a. Defining Clear Project Objectives and KPIs
Before creating reports with Power BI, it’s essential to establish clear project objectives and key performance indicators (KPIs). These objectives and KPIs will serve as the foundation for the reports and help ensure that the information presented is relevant and useful.
And Some examples of project objectives and KPIs in construction projects may include tracking progress against the project schedule, monitoring budget and expenses, and tracking resource allocation.
b. Choosing the Right Visuals and Data Filters
One of the key benefits of using BI is the ability to create custom visualizations and data filters to suit the specific needs of the project.
However, it’s essential to choose the right visuals and filters that effectively convey the information and insights needed.
For example, a Gantt chart may be suitable for tracking project timelines, while a pie chart may be better suited for displaying budget allocation.
c. Sharing and Collaborating on Reports
Power BI allows for easy sharing and collaboration on reports with team members and stakeholders.
By granting appropriate access and permissions, team members can view and interact with the reports to gain insights and make informed decisions.
Additionally, the ability to schedule and automate report updates can save time and ensure that everyone is working with the most up-to-date information.
It’s important to establish clear protocols and guidelines for sharing and collaborating on reports to ensure the information presented is accurate and consistent.
Challenges and limitations of using Power BI for construction project reporting

Power BI is a powerful tool for construction project reporting, but it is not without its challenges and limitations. One of the main challenges is dealing with data integration and data quality issues.
Also It is important to ensure that all relevant data sources are properly integrated and that the data is accurate and up-to-date. This can be particularly challenging in the construction industry, where data may come from a variety of sources and may be constantly changing.
Another challenge of using BI for construction project reporting is security and privacy concerns. Project data can be sensitive and confidential, and it is important to ensure that only authorized users have access to it.
BI offers a range of security and privacy features, such as role-based access control and data encryption, but it is important to use these features effectively to ensure that data remains secure.
Finally, you should now recognize that there are some limitations to the capabilities of Power BI. While it is a powerful tool for data visualization and analysis, it may not be able to handle certain types of data or calculations.
Also It is important to understand the tool’s capabilities and limitations and to use it appropriately to ensure accurate and meaningful reporting.
Despite these challenges and limitations, Power BI remains a valuable tool for construction project reporting. By understanding these challenges and implementing best practices for using the tool, project managers can effectively leverage Power BI to drive better decision-making and achieve project success.
Conclusion: The potential of Power BI for construction project reporting
In conclusion, Power BI is a powerful tool that can provide construction project managers with valuable insights and analytics. to make informed decisions. With its easy-to-use interface and customizable visualizations, BI can help streamline the reporting process, monitor project progress, and improve resource allocation.
However, while there are many advantages to using Power BI for reporting in construction projects, there are also some challenges and limitations to consider. Data integration and data quality issues, security and privacy concerns, and limitations of the tool’s capabilities can all pose challenges. By following best practices and staying aware of these potential issues, construction project managers can maximize the benefits of using BI for reporting and analytics.
Overall, Power BI offers great potential for improving project management in construction, and it’s worth exploring how this tool can be integrated into existing reporting processes.
Bonus
As a final note, we hope that this article has provided valuable insights and best practices of using BI.
At PM PRO, we understand the importance of effective project management and reporting in the construction industry, and we offer free consulting services to help you leverage the power of technology and data to drive your projects forward.
Don’t hesitate to contact us to learn more about how we can help you optimize your reporting processes and achieve your project goals.
Sources
- Construction Business Owner magazine article on using Power BI in construction: https://www.constructionbusinessowner.com/technology/power-bi-construction-data-reports
- Construction Executive article on Power BI and business intelligence in construction: https://constructionexec.com/article/the-power-of-power-bi-in-construction
- Power BI community forum for construction industry professionals: https://community.powerbi.com/t5/Industry-Solutions-Construction/bd-p/Ind_Construction

